11 September, 2001; 0600 GMT (2 AM EDT)
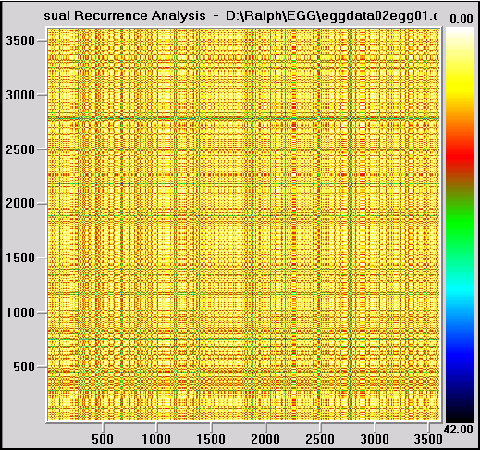
This is a recurrence plot of one hour of data from EGG #1, a time series of 3600 values, each representing the report from the EGG of the number of ones in a sequence of 200 random choices of 0 or 1. The color bar on the right gives the color code for the distances between data points. In this case, the embedding dimension is one.
Revised 17 June 2002 by Ralph Abraham